What is this 68–95–99.7?
“Empirical” means based on, concerned with, or verifiable by observation or experience rather than theory or pure logic.
— Oxford
The 68–95–99.7 was first coined and discovered by Abraham de Moivre in 1733 through his experimentation of flipping 100 fair coins. It was more than 75 years before the normal distribution model was introduced.
Formula
µ ± mσ where µ = mean/average; σ = standard deviation; and m = multiplier. (1, to get 68% of data; 2, to get 95% of data; 3, to get 99.7% of data)
Limitation
The Empirical Rule or the 68–95–99.7 is only applicable to Normal Statistical Distribution, therefore, it can only be applied to a distribution that is symmetric and unimodal.
Graphical Explanation
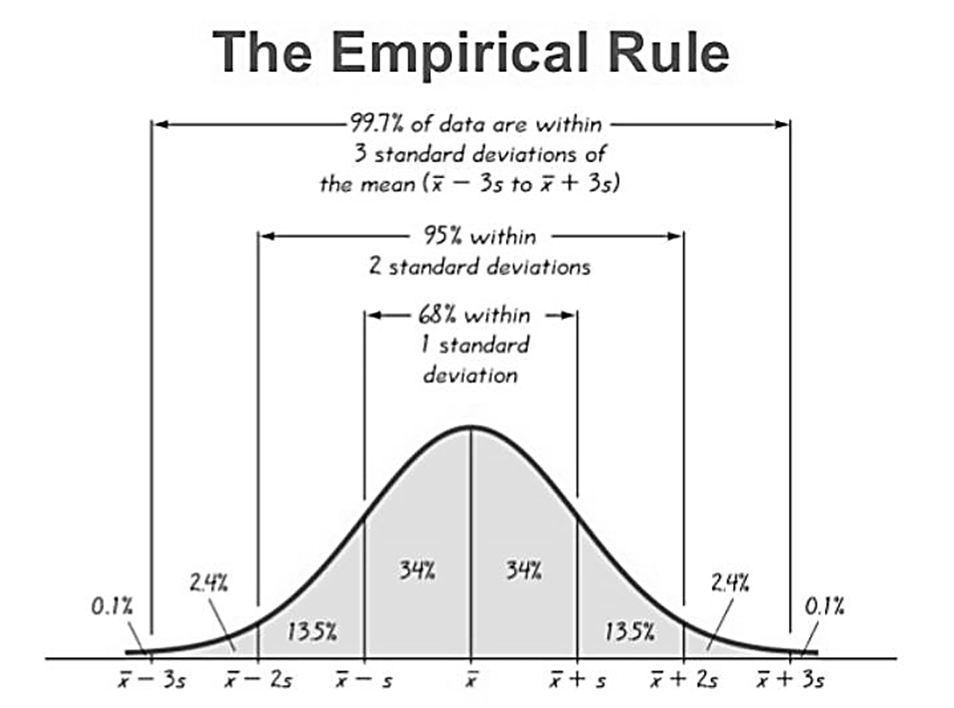
The Empirical Rule can easily be explained through the graph below:

The range of data from the (µ – mσ) and (µ +mσ) is 68% of the whole data if the multiplier (m) is equal to 1, where (µ – 1σ) to µ is 34% of the data. The same with µ to (µ + 1σ) since the distribution is symmetrical.
The range of data from the (µ – mσ) and (µ +mσ) is 95% of the whole data if the multiplier (m) is equal to 2, where (µ – 2σ) to µ is 47.5% (13.5% + 34%) of the data. The same with µ to (µ + 2σ) since the distribution is symmetrical.
The range of data from the (µ – mσ) and (µ +mσ) is 99.7% of the whole data if the multiplier (m) is equal to 3, where (µ – 3σ) to µ is 49.85% (2.35% + 13.5% + 34%) of the data. The same with µ to (µ + 3σ) since the distribution is symmetrical.
Identifying if a Set of Data has Normal Statistical Distribution
Empirical Rule can be used to identify if a set of data has normal statistical distribution. Below is an example of data that are the records of Housefly Wing Lengths in mm x10^(-1).
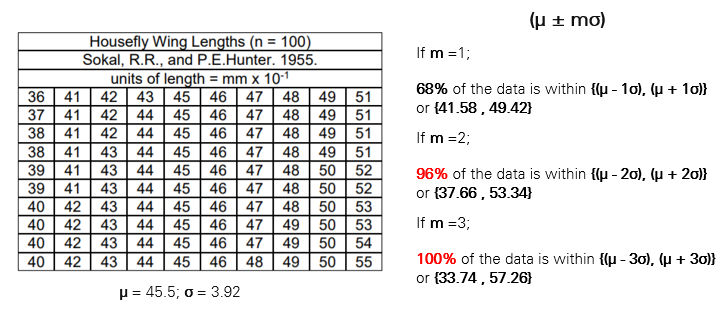
The mean and standard deviation were computed and resulted in 45.5 and 3.92, respectively. To get the range of data, we used the formula µ ± mσ. In first standard deviation, it covered exactly 68% of the data. Different from the 95% for second standard deviation, it resulted in 96% of data, and 100% of data for third standard deviation. This may indicate that the distribution of the data is not perfectly normal.
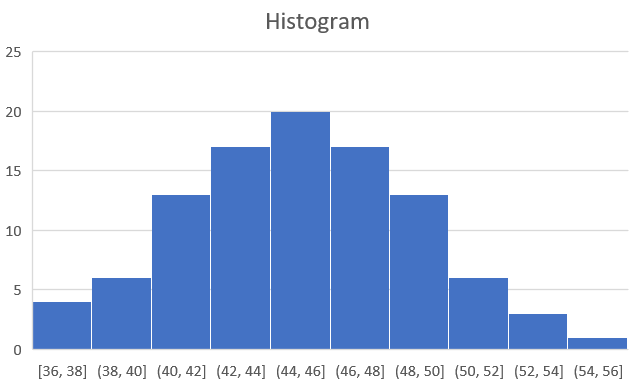
Getting the histogram of the data, the endpoints of the graph shows asymmetry.
Quick Estimate of a Presumed Normal Distribution
Instead of computing it manually, in a presumed normal distribution set of data, we can use 68–95–99.7 as is. We estimate the range of data by the definition of Empirical Rule.
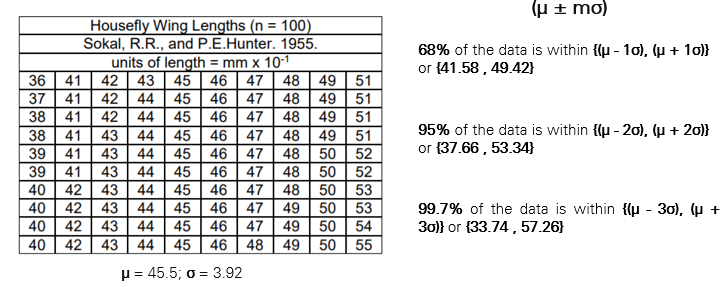
Comparing it to the actual computation we did, there might be errors between 0.3% to 1% which indicates a good estimation.
Quick Assumption of the Most Probable Input of New Data
The histogram also indicates the probability of the variable X in a set of data.

Using the Empirical Rule, we can estimate on what percent the new data would fall on a certain range as shown below:

Summary
- Empirical Rule is also known as 68–95–99.7
- Empirical Rule is only applicable to Symmetric and Unimodal (Normal) Distribution.
- Empirical Rule was discovered and coined by Abraham de Moivre in 1733.
- The formula of the Empirical Rule is µ ± mσ.

Leave a comment