— Should companies consider data visualization?
Data Visualization is the representation of data or information in a graph, chart, or other visual formats, and is used to drive action, to inform, and most importantly, to persuade.
Should companies pursue data visualization? Let us discuss the benefits of data visualization, and I hope it will help you in your decision-making on whether or not to consider data visualization.
1. Lesser Time Consumption on Meetings
Meetings are those double-edged swords in the company which can be an asset or a liability. According to the published article last June 17, 2020, entitled, Minutes (Wasted) of Meeting: 50 Shocking Meeting Statistics, a meeting would last up to 90 minutes and being conducted up to 17 times per week.
Time is Money. Time wasted on unnecessary and unproductive meetings is equivalent to money wasted.
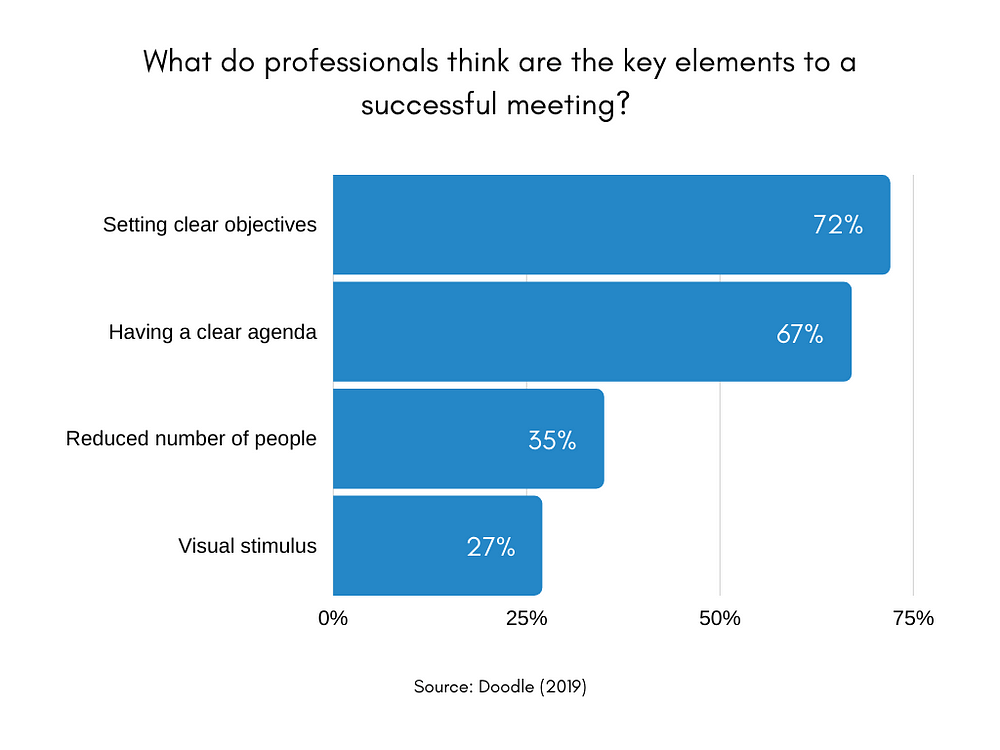
In data visualization, time is being considered because it will emphasize the most important data and would limit only information necessary for decision-making. The problem with meetings without data visualization is that most time is wasted on clarifications of the intent of the presentation, inadequate graphs, overloaded unnecessary information, and the relationship of the action requested with the information provided.
Data Visualization is audience-specific and is kept concise and simple for easy understanding of the message to convey. Surely, the meeting can be wrapped up faster when data visualization is applied.
2. Identification of New Insights
Data Visualization may also require exploratory data analysis, and only through visuals can we appreciate the data’s relationship with each other.
For example, your company is planning to transition from traditional to full paperless management. The data shows that more than 50% of your employees use MS Excel in Data Visualization.
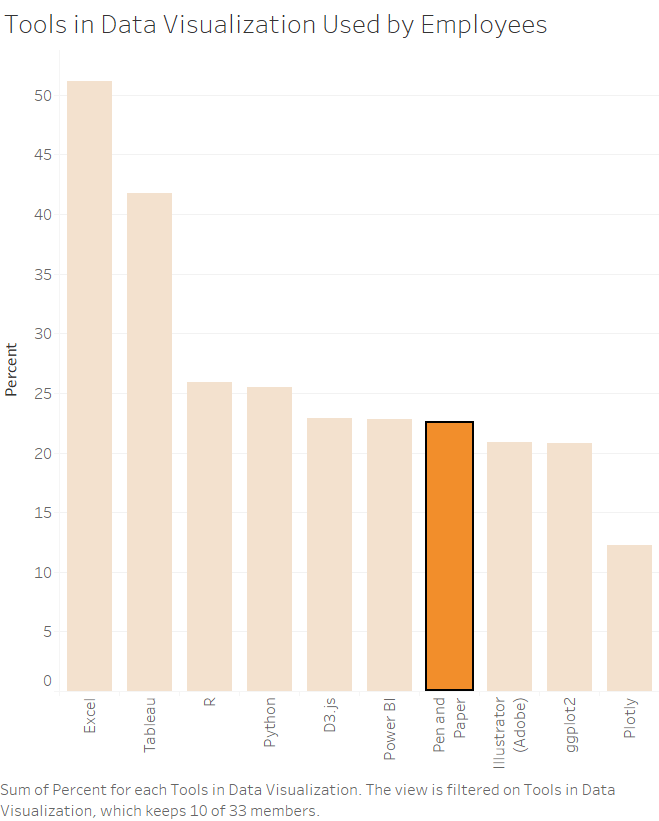
But you noticed that more than 20% of the employees use Pen and Paper as their tool in Data Visualization. The company may consider this because it may affect the employees’ productivity.
3. Useful in Planning and Reporting
Since data visualization usually provides new and interesting insights, it is useful, especially in business planning and reporting. Having reliable resources to back up your report and proposal is very useful in any kind of business.
To give you an example, on March 11, 2021, Mr. Edson C. Guido, a Data Analyst, posted on his Twitter Account about the number of confirmed COVID-19 cases in the Philippines. As shown below:
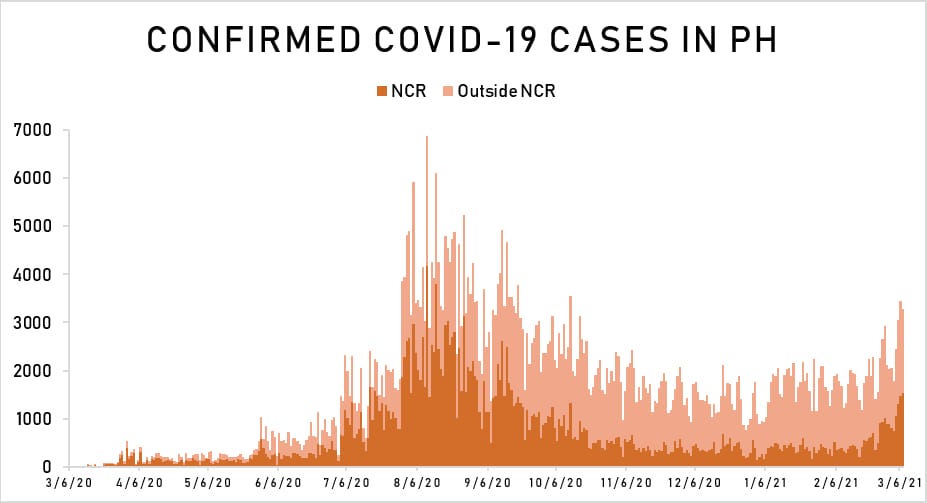
Initially, you would determine the date on which there is a high number of COVID-19 cases. In addition, you should also be worried about the trend being shown from February 6, 2021, to March 6, 2021. Knowing this, you will plan on the possible effects of the increase of COVID-19 cases in the area. Maybe re-schedule your travel to NCR.
The same thing within the office, if you implement data visualization and you have personnel who are experts in it, you can plan for preventive measures and contingencies.
4. Marketing
Yes, marketing. As mentioned, data visualization is used to persuade or to convince your audience.
For example, a Television Commercial aired on Philippine TV, used data visualization to convince Filipino to purchase their product as shown below:

More importantly, when using data visualization in marketing, insights should be true, accurate, and with reference or basis.
Remarks
The era today is already transitioning to a fast transaction and the time of everyone is significant. Making correct and accurate decisions means larger potential profit and lower potential expenses for the company. I hope that this will help you consider implementing data visualization in your company.
For any questions, please leave a note. Thank you.

Leave a comment